By Cameron Wilson · Published 2026-10-26 · As of 2026-10-26
Utah market update, October 26: price, terms and presentation matter more now
The Utah median home price chart I reviewed this morning is sitting at about $515,000. It has moved up and down this year, but the October point is back near April’s level. That’s useful context. But the bigger question I had during today’s market update was this: with more homes competing for atten
The Utah median home price chart I reviewed this morning is sitting at about $515,000. It has moved up and down this year, but the October point is back near April’s level.
That’s useful context. But the bigger question I had during today’s market update was this: with more homes competing for attention, what makes a buyer choose yours?
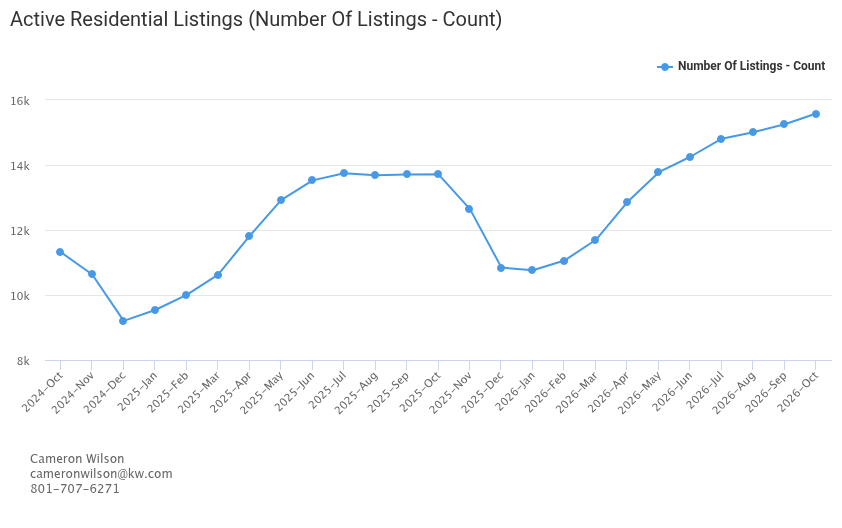
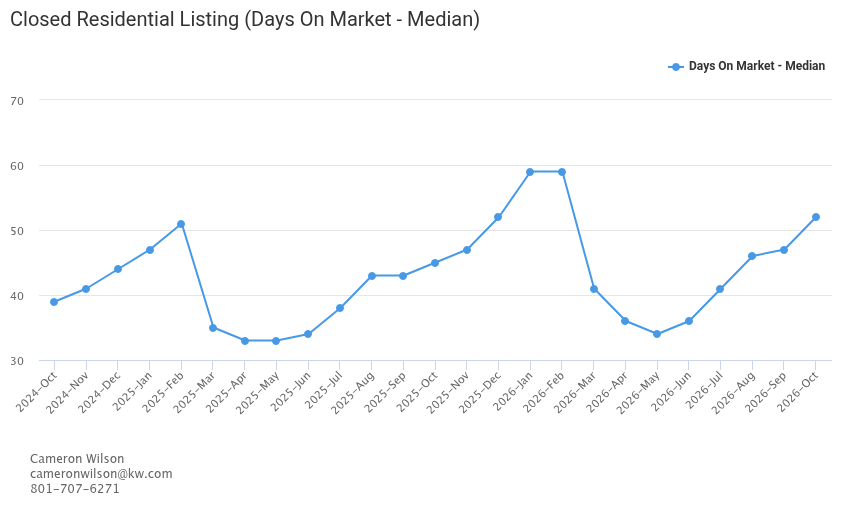
The other charts I reviewed show about 15,600 active residential listings, a median of roughly 52 days on market for homes that closed, and an average sold-to-original-list-price ratio of about 95.4%.
Those numbers make me want a better plan than putting a home online and waiting.
What I’m seeing in the charts
The active-listing chart is up from roughly 10,800 in January to about 15,600 in October. There are more homes in that chart competing for attention as we head toward the end of the year.
The median days-on-market chart has climbed from about 34 days in May to roughly 52 now. That measure looks backward at homes that closed. It gives us a reason to leave room in a seller’s timeline, but it doesn’t tell us how long a particular home will take or include every step through closing.
The sold-to-original-list-price ratio has moved lower, to about 95.4%. In this chart, sold prices are averaging roughly 4.6% below the original asking price. That includes the distance from the starting price, not just a negotiation at the end.
For scale, 4.6% of a hypothetical $500,000 original asking price is $23,000. That’s an illustration of the ratio, not a promised buyer discount, a loss in home value, or the amount a seller takes home.
The chart readings are approximate. The price chart represents Utah median home price. The geographic coverage and property filters of the other three charts still need confirmation, so I’m not treating them as separate Salt Lake County or Utah County statistics or assuming every chart measures the same market. All four are through October 26, not final October results.
If you’re selling, give a buyer a reason to choose your home
My conversation this morning came back to three things: price, terms and presentation.
Price: Look at what buyers can choose instead of your home. A price that made sense when you first started thinking about selling may need another look against today’s competition. I want us to have a clear reason for our asking price and pay attention to the response.
Terms: Sometimes the sticking point is the buyer’s payment or cash needed to close. That’s worth discussing with a lender before assuming a price reduction is the only conversation available. Any financing option needs a clear explanation of its costs, qualifications and how the payment could change.
Presentation: When buyers have choices, the home needs to give them a reason to come see it. How it looks online and in person should help them understand what makes it worth considering. A generic listing and hope aren’t much of a strategy.
We don’t have to do everything at once. We do need to be honest about which part of the plan is helping and which part needs work.
If you’re buying, use the room to compare
More choice can give you time to compare homes and ask better questions. What else is available? How does this home’s price compare? Are there terms worth discussing?
The market-wide numbers won’t answer those questions for a specific property. Some sellers have more flexibility than others, and some homes will attract stronger interest.
I also don’t want someone ruling out a move based only on a quick online payment estimate. Get the actual costs and payment options from a lender, then decide whether they fit. A lower starting payment deserves a close look at what happens later, too.
What I’d do with this information
For buyers and sellers in Salt Lake County and Utah County, I’d use these charts to start a more specific conversation: your neighborhood, your price range, your timeline and what you’re trying to accomplish.
For a seller, that means checking price, terms and presentation against the homes buyers can choose today. For a buyer, it means comparing the actual opportunities without assuming every listing comes with the same room to negotiate.
That’s where I think the useful work is this week. We have enough information to ask better questions and build a plan around your situation.