By Cameron Wilson · Published 2026-10-21 · As of 2026-10-21 · Week of October 19, 2026
Utah real estate market update: more listings, longer waits to sell
Cameron Wilson reviews Utah MLS charts and what more listings and longer selling times mean for buyers and sellers in Salt Lake County and Utah County.
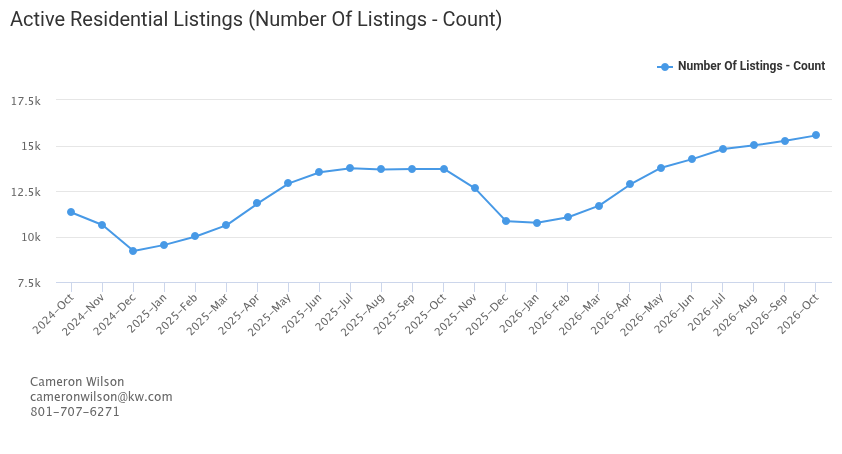
The number that jumps out at me in this week’s Utah real estate market review is about 15,600 active listings in the RapidStats charts I’m reviewing. A year ago, the same chart showed roughly 13,700.
That’s about 1,900 more homes competing for buyers, or approximately 14% more inventory. And the other charts aren’t showing a matching increase in homes under contract.
That’s why I’m not looking at this market and saying, “Just put your house up and give it a little time.” We need to know what we’re competing with and have a plan for the response we get.
I work with buyers and sellers in Salt Lake County and Utah County. My takeaway from this week’s charts is more competition for sellers and more time needed to sell, not a reason to tell everyone to stop moving. For a specific home, we still need to narrow the comparison to its neighborhood, price range and property type.
Here are the comparisons I’m looking at:
- Active residential listings: about 15,600 versus 13,700 last October. More homes are competing for attention.
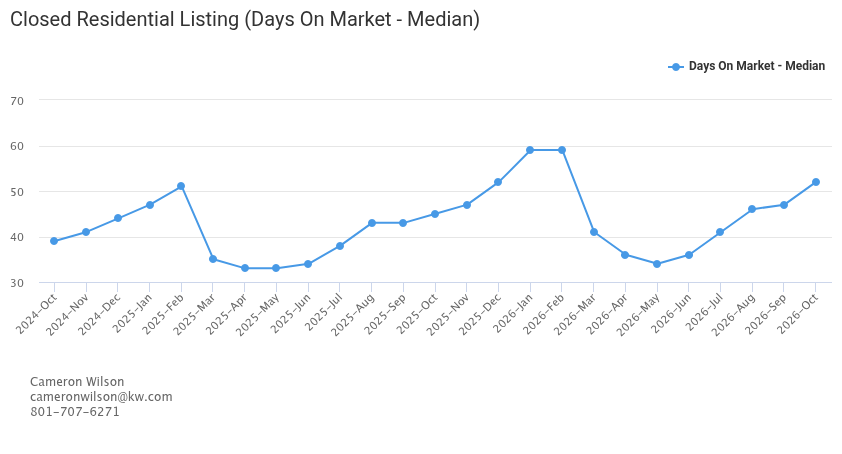
- Median days on market for closed residential listings: about 52 days versus 45 last October. That’s another week, and it’s up from about 34 days in May.
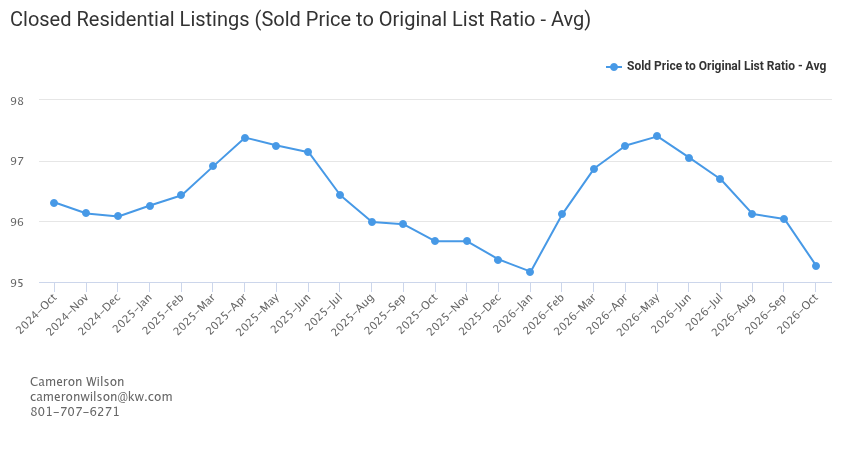
- Average sold price compared with original list price: about 95.3%, versus 95.7% last October and 97.4% in May. The gap between the starting price and the eventual sale price has widened since spring.
- Under-contract residential listings: about 3,900 versus 4,050 last October, roughly 4% fewer. That’s a count of homes under contract, not the number of completed sales or a measure of how quickly all inventory is selling.
Data source: RapidStats through UtahRealEstate.com / Wasatch Front Regional MLS. Figures are approximate visual readings from chart screenshots supplied on October 21, 2026. October is still in progress, and the screenshots do not show their exact data cutoff or geographic filters. These are not confirmed statewide totals or separate Salt Lake County or Utah County statistics. Treat the October point as provisional, not a completed-month result.
More inventory matters when you’re the one trying to sell
That combination is what has my attention: more active listings, but not more homes under contract in this comparison.
It doesn’t mean every home will struggle. It means I want a seller to understand the alternatives a buyer has. If someone can choose between your home and several similar homes, what gives them a reason to choose yours?
In Monday’s conversation, I said I would be watching whether inventory starts coming down in November. I still think that’s worth watching. If that competition stays high, I’d be more cautious about expecting time alone to fix a quiet listing.
I’m not predicting a crash. I’m saying the current chart gives us a reason to take competition seriously.
Fifty-two days is a planning signal, not a deadline
The closed-listing chart’s median is about 52 days on market. Last October it was about 45. In May it was about 34.
That spring-to-fall change is meaningful, but seasonality matters, which is why I also want the same-month comparison. Either way, I don’t want a seller building a plan around an immediate offer.
This is also a backward-looking measure. These are homes that closed, not a promise about the home we list today. Fifty-two days isn’t “52 days until you get your money,” and it doesn’t mean every home takes that long.
What it does tell me is that timing deserves a real conversation before we list. If you need to move by a particular date, we should work backward from that date and leave room for the contract-to-closing process, not just the search for a buyer.
The 95.3% number is about expectations
The sold-to-original-list ratio is the other number I’d want a seller to understand.
At approximately 95.3%, the average ratio on this chart puts the sale price about 4.7% below the original asking price. In May, the ratio was around 97.4%, a gap of about 2.6%.
For scale, 4.7% of a hypothetical $600,000 starting price is $28,200. That’s an illustration, not a valuation or an expected discount on your home.
And this is not what a seller nets after commissions, closing costs or a mortgage payoff. It also does not mean home values fell 4.7%. It measures the relationship between the original asking price and the eventual sold price.
My takeaway is that the starting price and the market’s answer are not always the same thing.
We can test a higher price and accept the possibility of more time and reductions. Or we can start more competitively. I want that to be an intentional choice, not something we discover after several frustrating weeks.
There’s a buyer side to this, too
More choices can give a buyer room to compare homes and ask about terms. It does not mean every seller will negotiate, or that a discount automatically makes the payment comfortable.
I want your lender to show you the full monthly payment and cash needed to close. If a financing option lowers the initial payment, understand its costs and whether that payment can change. The CFPB’s Loan Estimate guide explains where to check those details.
And if you’re selling and buying, look at both sides. You might accept less than you hoped on your current home and have more room to negotiate on the next one. Those two things don’t automatically offset, but we should do the math before deciding a move won’t work.
That’s my take this week: the charts give me a reason to be realistic, not a reason to tell everyone to stay put.
If you’re thinking about buying or selling in Salt Lake County or Utah County, let’s look at your home, your options and what you’re trying to accomplish. If the move works, we’ll build a plan. If waiting makes more sense, I’ll tell you that, too.
A 30-minute real estate conversation about your situation.
Sources
- CFPB Loan Estimate guide · checked 2026-10-21
- UtahRealEstate.com: RapidStats integration and customizable market areas · checked 2026-10-21